Results · Ahrefs · Google Analytics 4 · Google Search Console
What the system achieved in six months.
Every number below was produced by the Agentic SEO System running one real website.
§ 01
Summary
What the system moved, in six months.
Search Console’s own comparison of the six months the system ran this site against the six before it, read off the report in Exhibit D below. The multiples are calculated from the rounded figures Google prints, so they are the shape of the change rather than four significant figures.
- 8.8×
- Clicks
916 → 8.09K - 7.2×
- Impressions
63.3K → 453K - +0.4 pp
- Average CTR
1.4% → 1.8% - −2.2
- Average position
8.6 → 6.4
§ 02
Exhibits
Every stage of it, unedited.
Five views, in the order the system moved them: it earned the rankings, the rankings turned into traffic, the traffic arrived as real sessions in Analytics, the sessions became clicks Google will admit to, and the same pages now surface inside AI answers. Each plate names the tool and the comparison the tool was set to — and, where a report measures something narrower or broader than it looks, says so underneath.
Exhibit A · Ahrefs · Organic positions
15 March – 13 September 2026
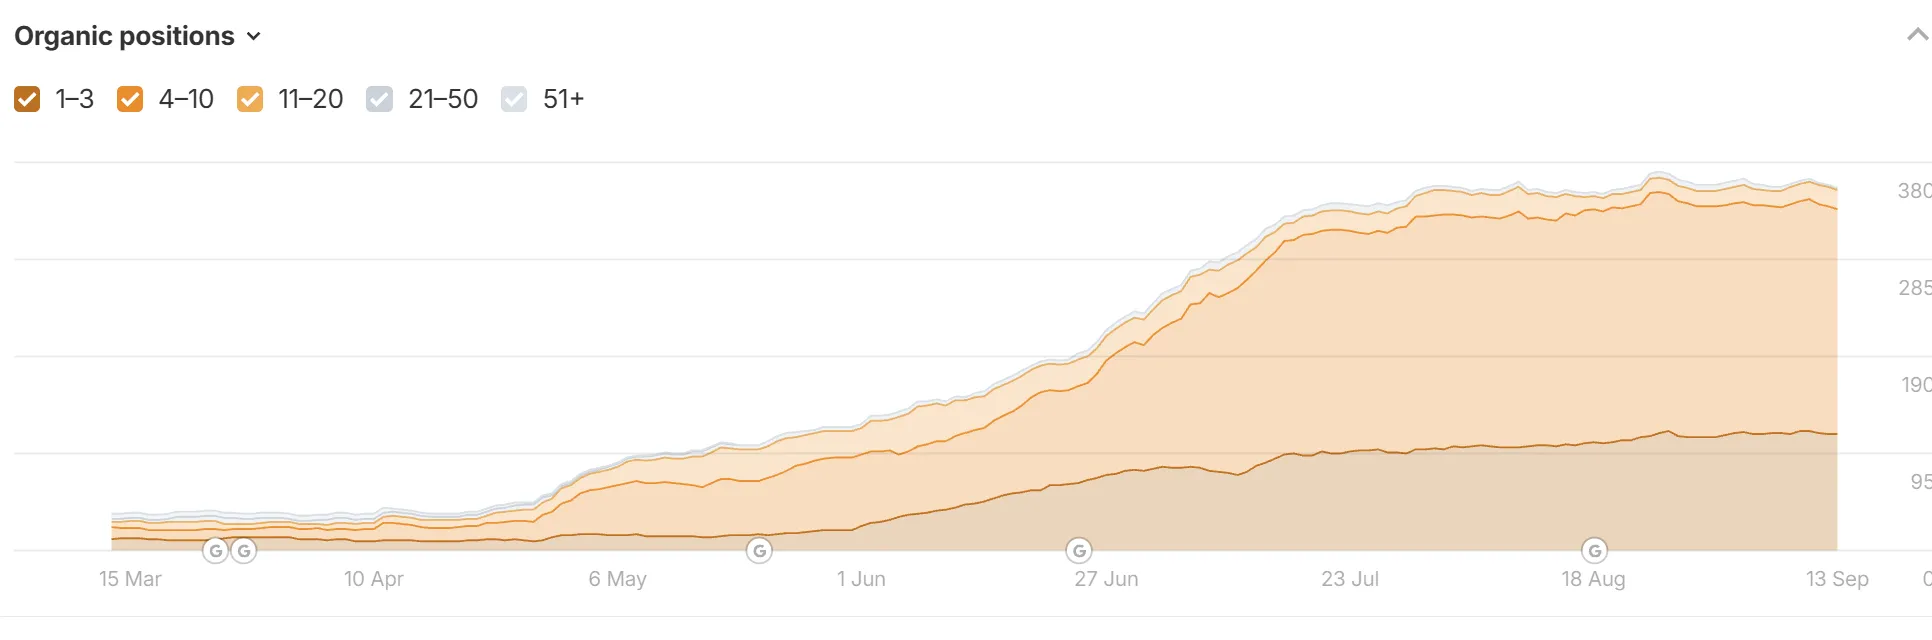
- Ranking keywords
- ~20 ~380 ≈19× Read from the chart axis — Ahrefs prints no total on this view
Exhibit B · Ahrefs · Organic traffic by intent
15 March – 13 September 2026
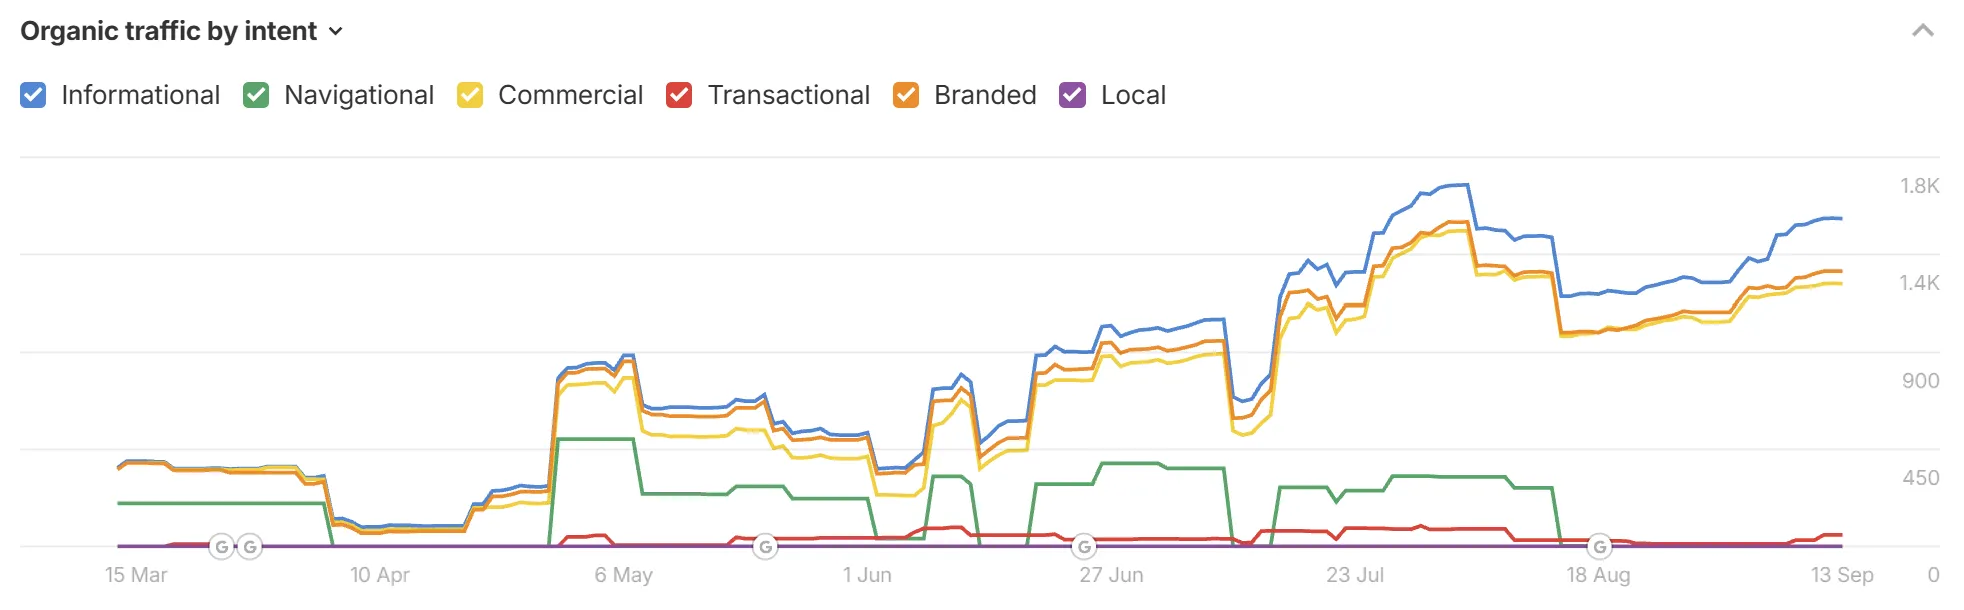
Ahrefs traffic is a model, not a measurement — it estimates visits from rank and keyword volume. It earns its place on the intent split, which neither GA4 nor Search Console shows. The absolute numbers worth trusting are in the next two exhibits.
Exhibit C · Google Analytics 4 · Reports snapshot
Last 90 days vs previous period · Captured 6 September 2026
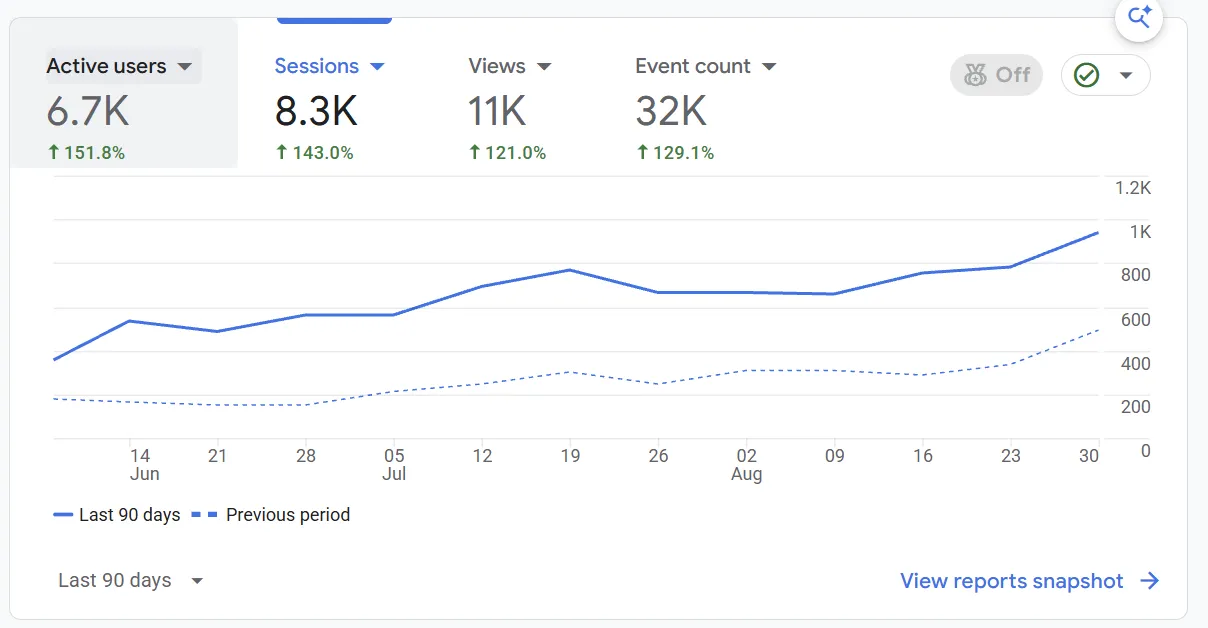
- Active users
- 6.7K +151.8%
- Sessions
- 8.3K +143.0%
- Views
- 11K +121.0%
GA4 counts every visit, not only organic search. This view is unfiltered, so direct, referral and social sessions are inside these totals — unlike the Search Console and Ahrefs exhibits, which are organic only. It is here to show the sessions actually landed on the site, not to restate the organic numbers in a second currency.
Exhibit D · Google Search Console · Performance · Search results · Web
Last 6 months vs previous 6 months
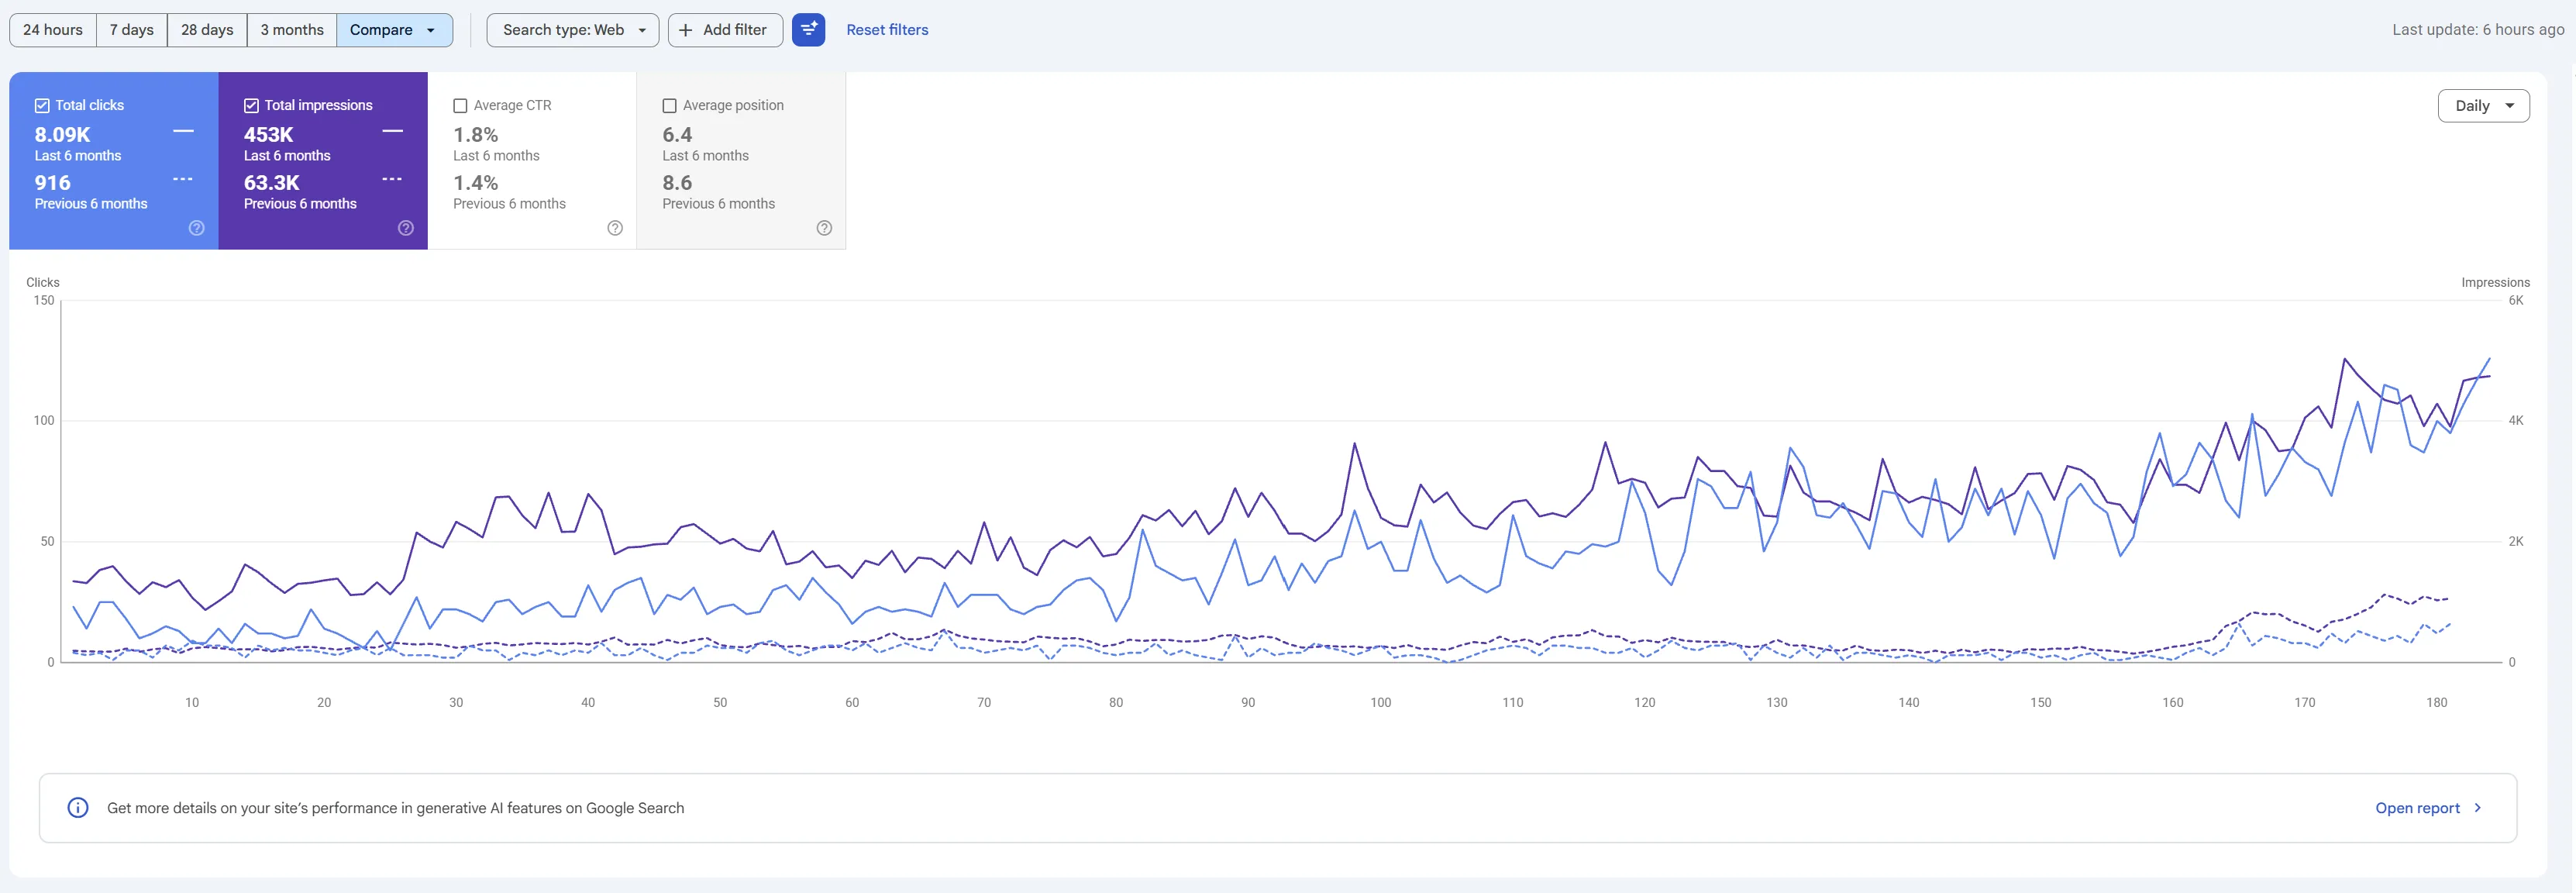
- Clicks
- 916 8.09K 8.8×
- Impressions
- 63.3K 453K 7.2×
- Average CTR
- 1.4% 1.8% +0.4 pp
- Average position
- 8.6 6.4 −2.2
Exhibit E · Google Search Console · Performance · Generative AI features (Beta)
Last 28 days vs previous 28 days
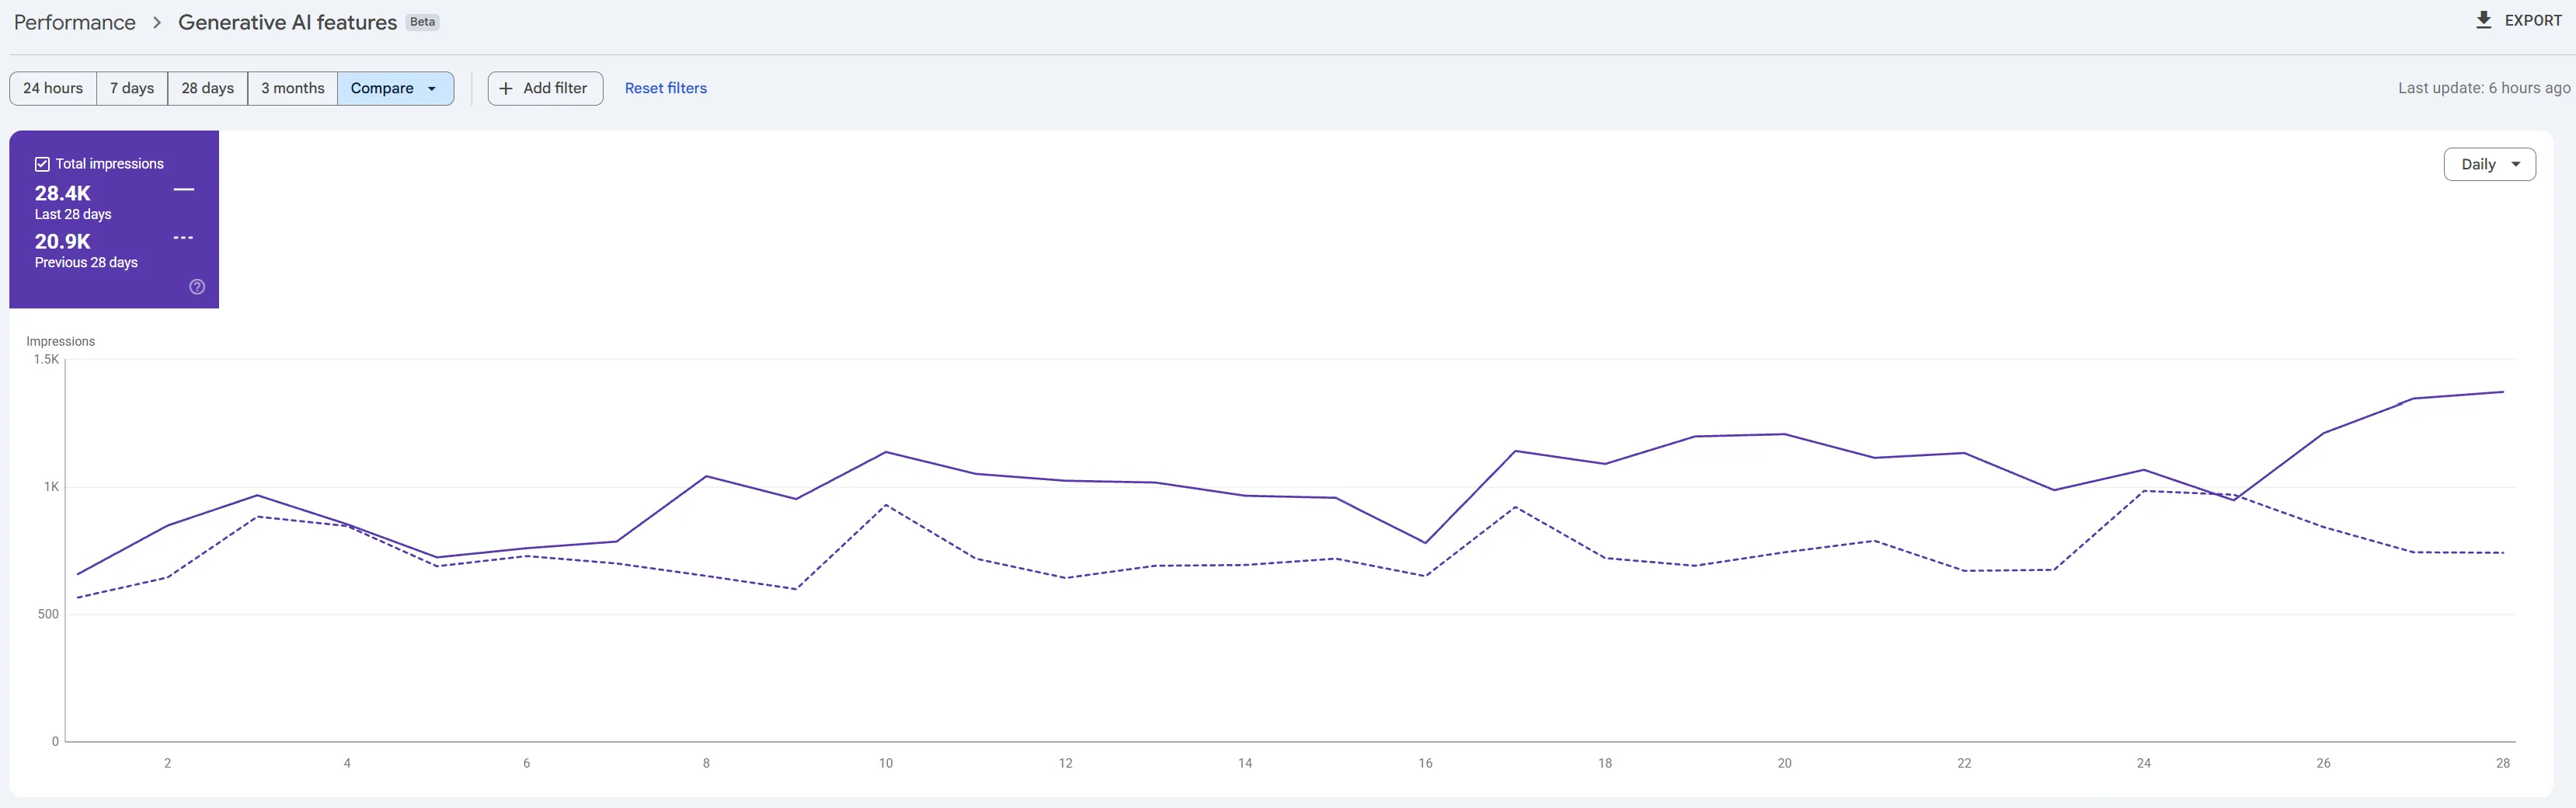
- Impressions in AI features
- 20.9K 28.4K 1.4×